# Scaling and health-checks
Verda Containers service comes with **autoscaling** support. Scaling rules are applied whenever the maximum number of replicas (i.e. worker nodes) per deployment is set higher than the minimum.
### Queue load
We use an internal queue to handle incoming requests.
The default scaling is **Queue load** only.
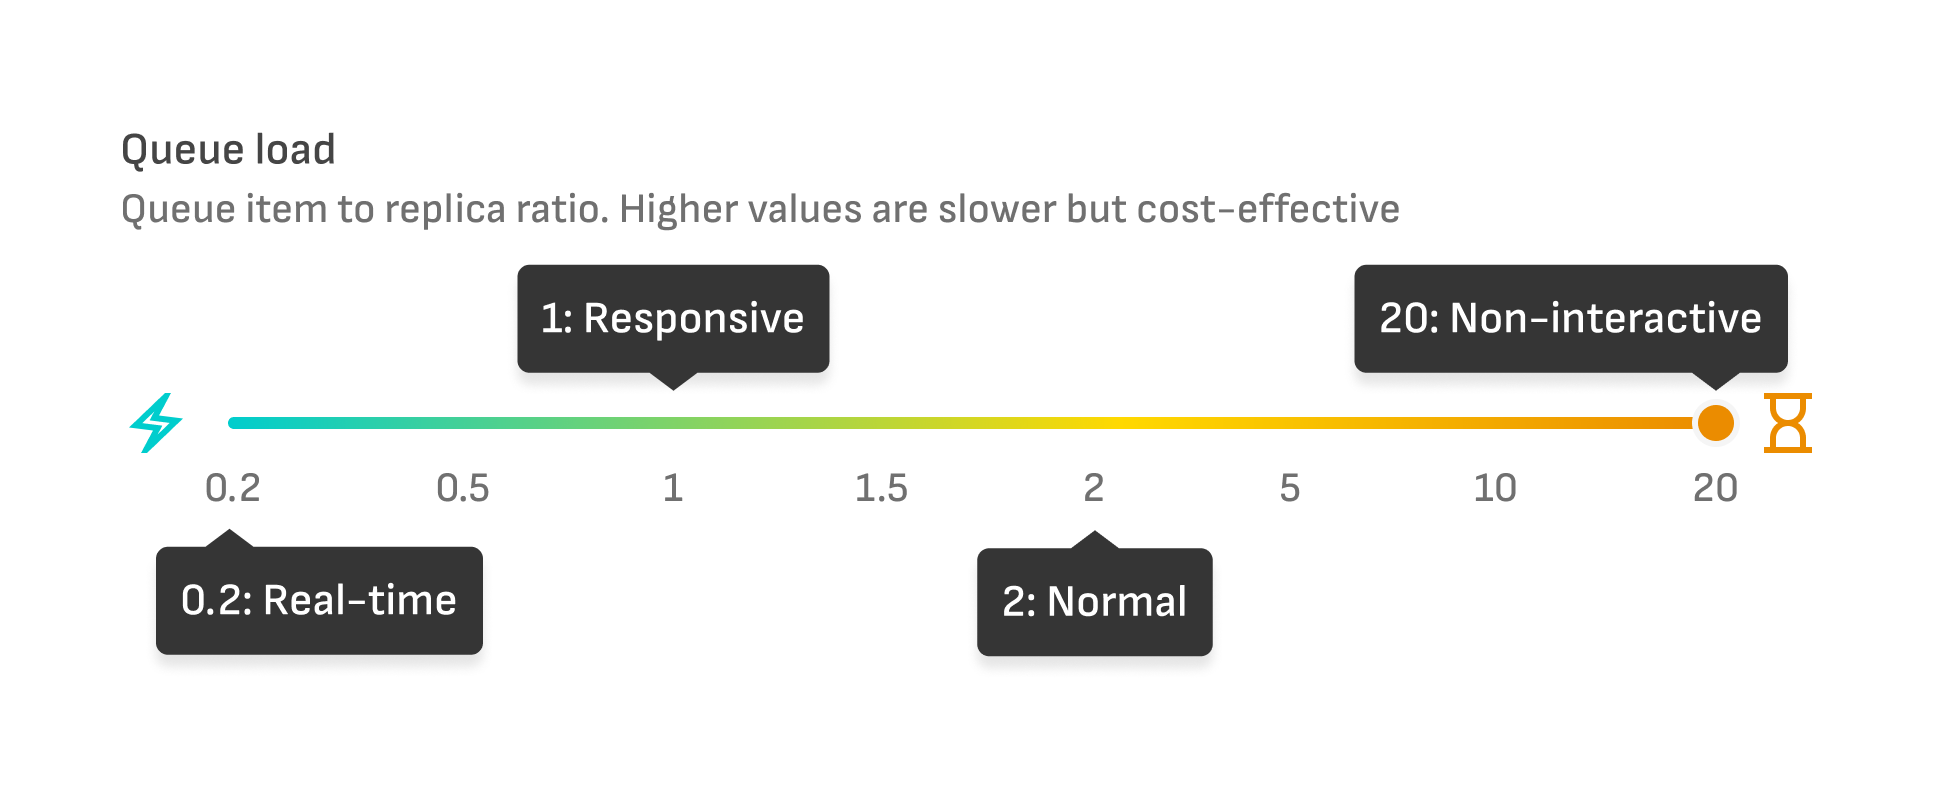
You can adjust the scaling sensitivity based on the queue length (number of message in queue) per replica: $$queue\_load = \dfrac{queue\_length}{num\_replicas}$$.
Small values indicate sensitive scaling, while larger values allow queues to fill up before new replicas are created.
Example use cases:
* You want to run low-priority batch jobs overnight. Setting the maximum queue load value will keep costs down while using a small number of replicas.
* Your service runs an image generation for premium paid users. Setting the minimum queue load value will make sure no requests are idly waiting for a replica.
{% hint style="info" %}
For the queue load scaling, only messages in the queue are counted. If a replica has picked up the message, it is not counted towards the queue length.
Example: Queue load 2 with 10 replicas means there are 20 messages in queue plus 10 messages in progress before any scaling happens.
{% endhint %}
{% hint style="warning" %}
Please consider your average inference duration when calculating the queue load. If you run a quick image generation algorithm (say 3 seconds per request), a queue load of 0.5 means that the average request will wait 1.5 seconds before being picked up for processing.
If you generate video (say 1 minute per request), a queue load of 0.5 means that the average request will wait 30 seconds before being processed.
{% endhint %}
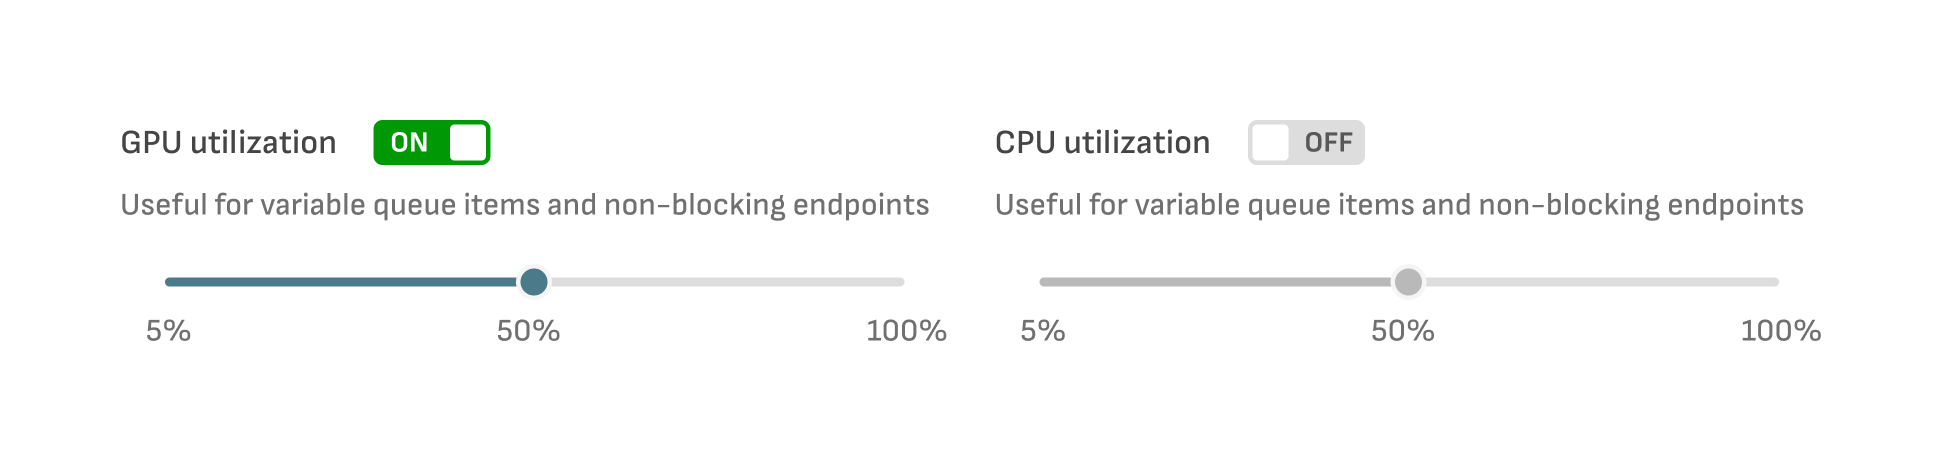
### CPU and GPU utilization
Additional Scaling Metrics currently available are **CPU utilization** and **GPU utilization** (calculated as averages per deployment). In practice, these are not as reliable as queue-based scaling. Depending on the nature of your workload, these may prove useful, for example, when you have known specific CPU-usage pattern for CPU-heavy jobs.
Scaling up occurs after one of the enabled scaling metrics is exceeded, and conversely, scaling down occurs when all metrics are below the scaling thresholds.
### Additional scaling attributes
Additional attributes that you can control the behavior of scaling are:
* **Scale-up delay** - Time to delay spawning new replicas after the scale-up threshold has been exceeded.
* **Scale-down delay** - Time to delay reducing the number of replicas after all of the scaling metrics have gone below the threshold.
* **Request message time to live (TTL) -** Time before a request is deleted, this combines both time in the queue and the actual inference.
### Controlling downscaling
To avoid terminating replicas that are actively doing work, a `SIGTERM` handler can be used. When a replica has been selected for downscaling, it is sent a `SIGTERM` and given a grace period (30 seconds) to exit - after this it will be forcefully terminated (with a `SIGKILL`), losing any work in progress.
{% hint style="info" %}
If the 30-second timeout after receiving `SIGTERM` is not enough for your needs, please contact .
{% endhint %}
The below snippet contains a sample signal handling implementation for [FastAPI](https://fastapi.tiangolo.com/advanced/events/?h=lifespan). Different methods can be used. The sample will stop receiving requests and wait 30 seconds before exiting, but the cost-conscious user can implement a mutex that is toggled at the beginning and end of the predict function, allowing the application to exit the instant the mutex is toggled from busy to free.
```python
import signal, uvicorn, logging, asyncio
from fastapi import FastAPI
from fastapi.responses import JSONResponse
from contextlib import asynccontextmanager
logging.basicConfig(level=logging.INFO)
logger = logging.getLogger(__name__)
sigterm_received = False
def sigterm_handler(sig, frame):
global sigterm_received
logger.info(f"Received signal {sig}, starting graceful shutdown")
sigterm_received = True
@asynccontextmanager
async def lifespan(app):
# Setup signal handlers during startup
signal.signal(signal.SIGTERM, sigterm_handler)
signal.signal(signal.SIGINT, sigterm_handler)
yield
# Wait for existing requests to complete (max 30s)
wait_seconds = 0
while sigterm_received and wait_seconds < 30:
logger.info(f"Waiting for requests to complete ({wait_seconds}s)")
await asyncio.sleep(1)
wait_seconds += 1
app = FastAPI(lifespan=lifespan)
# semaphore with 1 slot → acts like a Lock
max_concurrency = 1
busy_semaphore = asyncio.Semaphore(max_concurrency)
@app.get("/")
async def read_root():
return {"message": "Hello World"}
@app.get("/predict")
async def predict():
await busy_semaphore.acquire() # Acquire a slot
try:
await asyncio.sleep(15) # Simulate long-running request
return {"message": "Prediction completed"}
finally:
busy_semaphore.release()
@app.get("/health")
async def health_check():
# Report unhealthy during shutdown to prevent new requests
if sigterm_received:
return JSONResponse(status_code=503, content={"status": "shutting_down"})
# _value is how many slots remain
if busy_semaphore._value == 0:
return JSONResponse(status_code=200, content={"status": "busy"})
return JSONResponse(status_code=200, content={"status": "healthy"})
if __name__ == "__main__":
uvicorn.run("main:app", host="0.0.0.0", port=8000, timeout_graceful_shutdown=30)
```
In the above snippet, `lifespan` a context manager is used to register signal handlers before FastAPI starts serving requests, after which control is yielded to the regular request handlers.
### Health checks
Health checks are an integral part of the system, knowing when a replica is ready to receive requests. If not implemented, the newly started container can receive a request before it's ready and return a `500 internal error` to incoming requests.
We do not throttle at errors, but pass them through to the caller, so there is a chance that several or a lot of requests are picked from the queue and fail processing.
Health checks can also be used to control when the replica gets traffic. Our system records a replica's health status and only sends work to replicas posting ready status.
Health check returns are as follows:
* **Healthy:**
* Any non-JSON body with `HTTP 200 OK` response
* JSON body with `HTTP 200 OK` response, with`status` having values `ok`,`ready`,`healthy`, `running`, or `up` , for example: `{ "status": "ok" }`
* **Unhealthy:**
* Other HTTP codes. It's good practice to use a `5xx` code here.
* JSON body with `HTTP 200 OK` response, with`status` having value `unhealthy`
* **Busy (**currently optional):
* JSON body with `HTTP 200 OK` response, with`status` having value `busy`